30 September 2026
Click a track to see it on the intensity graph
In the Ride Builder, click a track: a dot marks it on the intensity graph, and follows it when you move it.
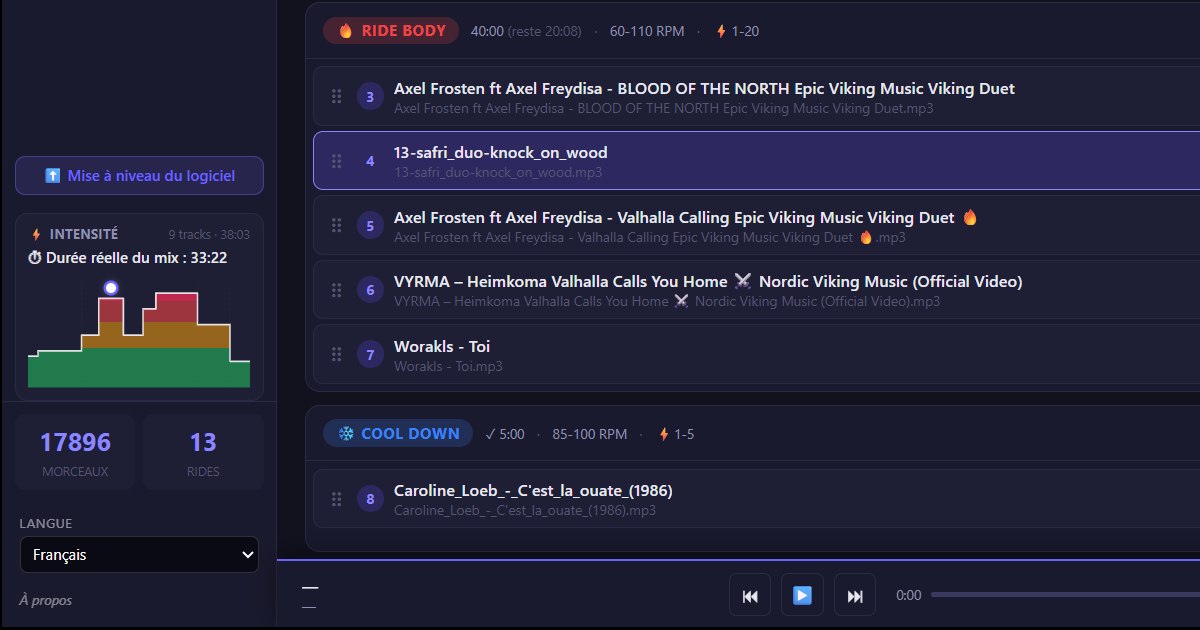
While you build a ride, the small Intensity graph at the bottom left of the screen draws the shape of your class: one step per track, at the height of its intensity, from recovery green to all-out red.
Move a track, and the graph changes shape. But one question stayed open: which of those steps is the track I just moved?
On a ride of nine or ten tracks, you had to count the steps.
One click, one dot
Since version 2.0.12, click a track in the Ride Builder. The row is outlined, and a dot appears on the graph, right above that track's step.
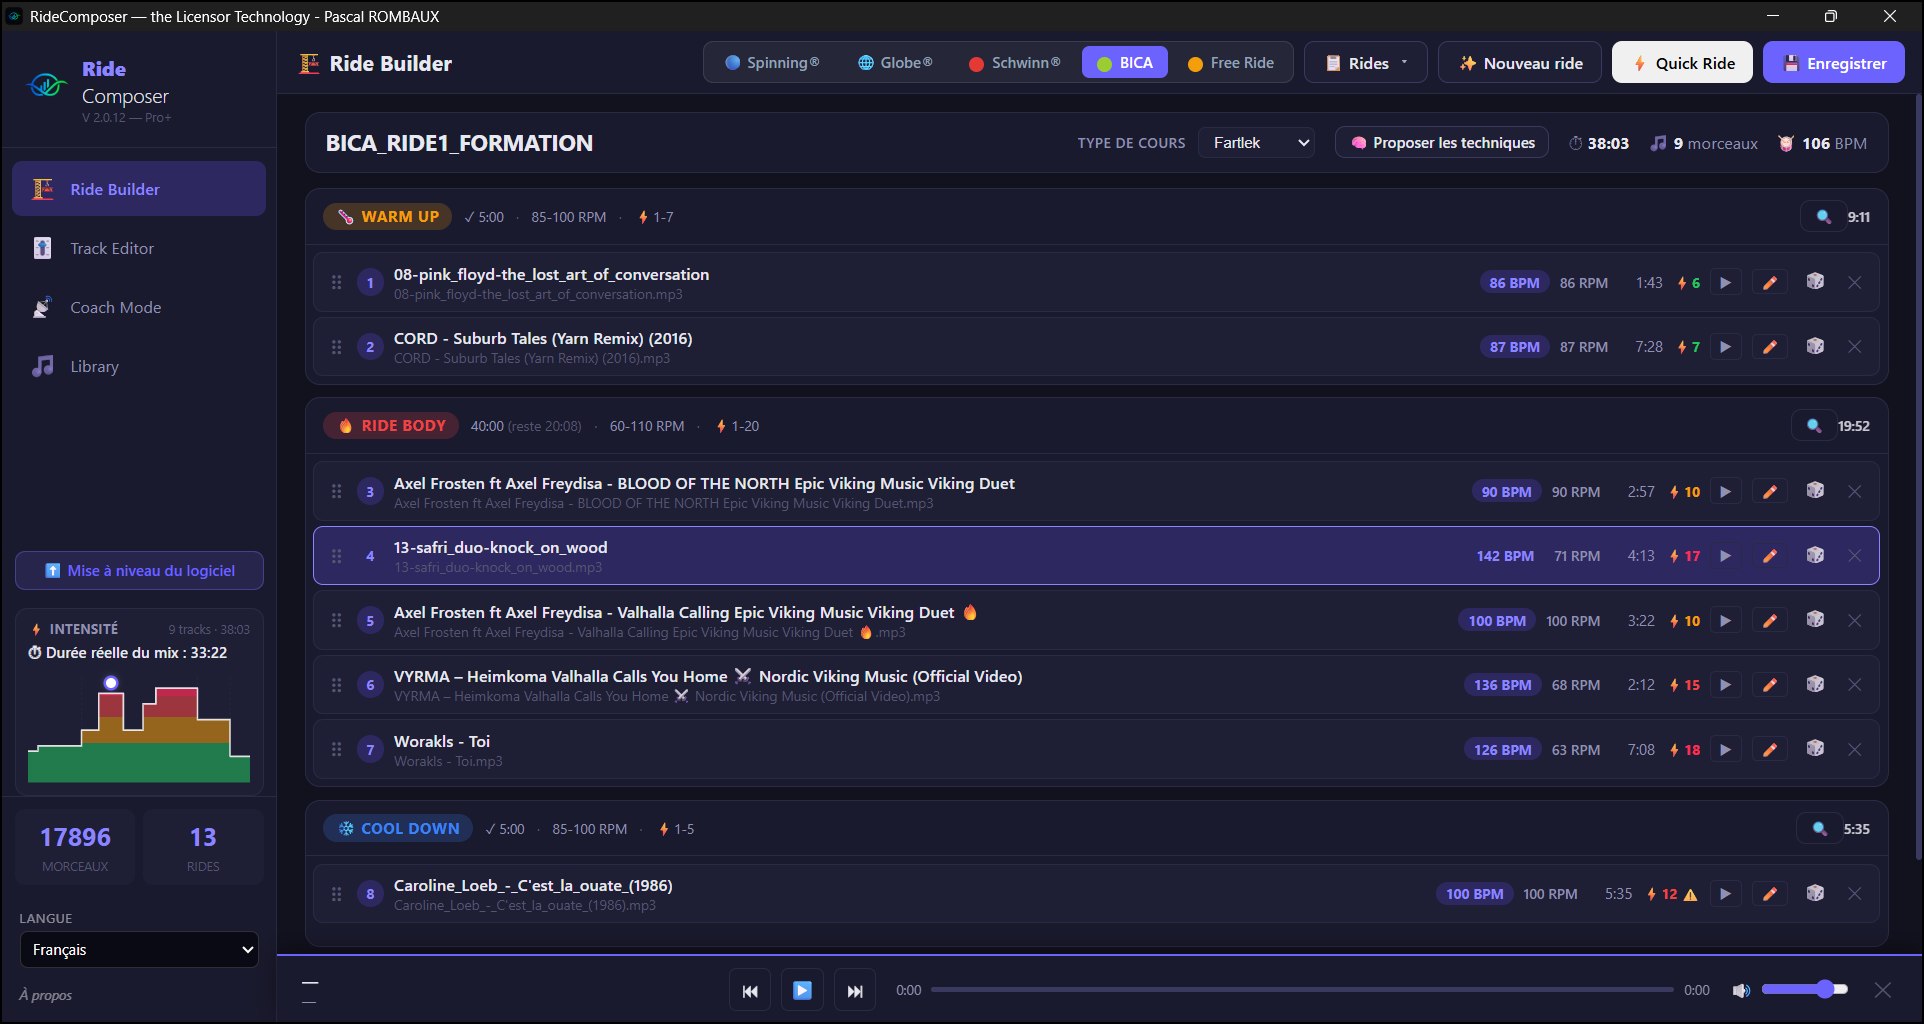
In the screenshot, track 4 is selected. Its dot sits on the first big step of the Ride Body, at 17 out of 20: you can see at once that it comes early in the class, right after a moderate step.
The dot follows the track
This is where the feature earns its place. Drag the selected track somewhere else in the ride: it stays selected, and the dot follows it on the graph.
So you see, live, what your move does to the curve of the class:
- an effort that comes too early, before the room is warm;
- two red steps back to back, with no recovery in between;
- a climb that drops off too fast before the cool down.
You no longer read the graph by counting: you read it by looking.
Easy to use
- One click on a row selects it.
- A second click on the same row deselects it, and the dot disappears.
- The row's buttons (▶ listen, ✏️ edit, 🎲 replace, ✕ remove) keep their job: clicking them selects nothing.
The feature is available on every plan, from version 2.0.12. If your RideComposer tells you an update is available, download it from ridecomposer.com.